

Please click the button to download “MECT2017 Final Report” Download “Adobe Reader”
| Day | Weather | Domestics | Overseas | Total Number of Visitors |
|---|---|---|---|---|
| Oct. 18th Wed. | Cloudy | 18,131 | 266 | 18,397 |
| Oct. 19th Thr. | Rainy | 19,402 | 484 | 19,886 |
| Oct. 20th Fri. | Cloudy, rain later | 25,687 | 520 | 26,207 |
| Oct. 21st Sat. | Rainy | 27,593 | 222 | 27,815 |
| 90,813 | 1,492 | 92,305 | ||
| MECT 2007 |
MECT 2009 |
MECT 2011 |
MECT 2013 |
MECT 2015 |
MECT 2017 |
|
|---|---|---|---|---|---|---|
| Number of exhibitors | 377 | 349 | 365 | 464 | 444 | 457 |
| Number of booths | 1,953 | 1,178 | 1,490 | 1,747 | 1,915 | 1,933 |
| Dates | 10/17~ 10/20 |
10/14~ 10/17 |
9/29~ 10/2 |
10/23~ 10/26 |
10/21~ 10/24 |
10/18~ 10/21 |
| Number of visitors | 93,872 | 90,920 | 83,057 | 93,741 | 94,124 | 92,305 |
70.5% of exhibitors “would like to join the next MECT”
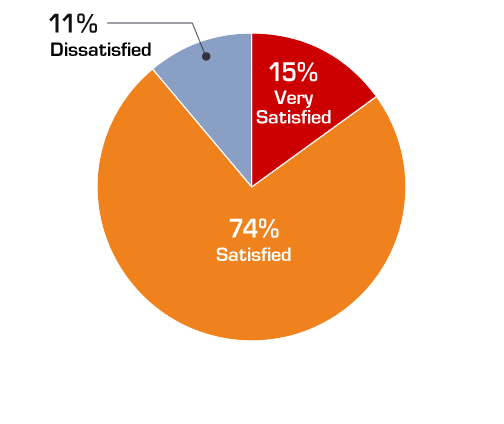
![This is the pie chart, which indicates how many visitors feel satisfied: 17.9% feels [Very Satisfied] and 52.6% feels [Satisfied].](../img/about/img_graph_01_manzoku2017.jpg)
Feedbacks
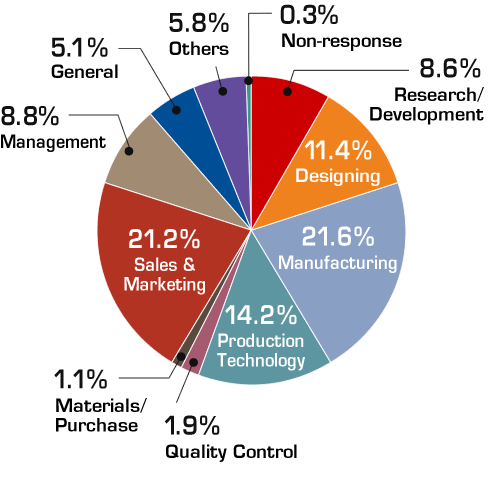
![This is the pie chart, which indicates the percentage of the visitors' business: 23.4% is [Automobile/Parts] and 16.0% is [General Machines].](../img/about/img_graph_04_gyousyu2017.jpg)
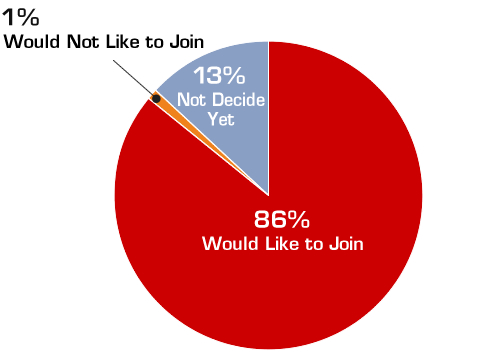
86% of exhibitors “would like to join the next MECT”
Feedbacks
![This is the pie chart, showing that how the exhibitors evaluate the number of visitors: 21% feel [Very Many] and 34% feel [Many].](../img/about/img_graph_09_hyouka2017.jpg)
![This is the pie chart, showing how exhibitors evaluate the result of MECT2017: 30% feel [Very Satisfied], and 41% feel [Satisfied].](../img/about/img_graph_10_hyouka_sougou2017.jpg)

